Method coeffNonneg.
Usage
SensorModelNames()

defaultParSensorModel()

SensorModel(...)
Arguments
- ...
- parameters of constructor.
Value
Character vector of model names.
List of the default parameters.
Description
Method coeffNonneg.
Class SensorModel predicts a sensor signal
in response to an input concentration matrix by means of
a regression model stored in slot dataModel.
Function to get model names of class
SensorModel.
Function to get default constructor parameters of class
SensorModel.
Constructor method of SensorModel Class.
Wrapper function SensorModel.
Details
The model explicitely assumes that the sensor response to
a mixture of analytes is a sum of responses to the
individual analyte components. Linear models mvr
and plsr follow this assumtion in their nature.
Slots of the class:
num |
Sensor
number (1:17). The default value is 1. |
gases |
Gas indices. |
ngases |
The number of gases. |
gnames |
Names of gases. |
concUnits |
Concentration units external to the model, values given in an input concentration matrix. |
concUnitsInt |
Concentration units internal for the model, values used numerically to build regression models. |
dataModel |
Data model
of class SensorDataModel performs a regression
(free of the routine on units convertion, etc). |
coeffNonneg |
Logical whether model
coefficients must be non-negative. By default,
FALSE. |
coeffNonnegTransform |
Name of transformation to convert negative model coefficients to non-negative values. |
beta |
(parameter
of sensor diversity) A scaling coefficient of how
different coefficients of SensorDataModel will be
in comparision with those coefficients of the UNIMAN
sensors. The default value is 2. |
Methods of the class:
predict |
Predicts a sensor model response to an input concentration matrix. |
coef |
Extracts the
coefficients of a regression model stored in slot
dataModel. |
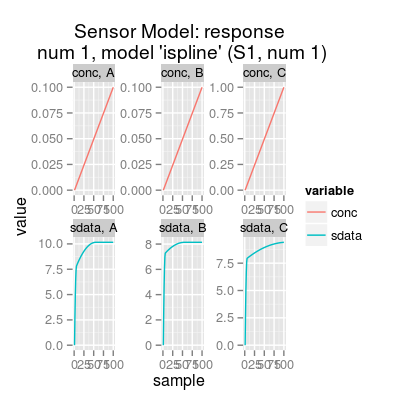
The plot method has two types (parameter
y):
response |
(default) Shows the sensitivity curves per gas in normalized concentration units. |
predict |
Depicts
input (parameter conc) and ouput of the model for
a specified gas (parameter gases). |
Examples
# sensor model: default initialization sm <- SensorModel() # get information about the model show(sm)Sensor Model (num 1), beta 2, data model 'ispline'print(sm)Sensor Model - num 1 - beta 2 - 3 gases A, B, C - (first) data model - method: ispline (type: spline) - sensor model: coeffNonneg TRUE -- coefficients (first): 7.5816, 2.5812, 0 ... 0print(coef(sm)) # sensitivity coefficients[,1] [1,] 7.581598 [2,] 2.581216 [3,] 0.000000 [4,] 7.194504 [5,] 0.946807 [6,] 0.000000 [7,] 7.869399 [8,] 1.551513 [9,] 0.000000plot(sm)
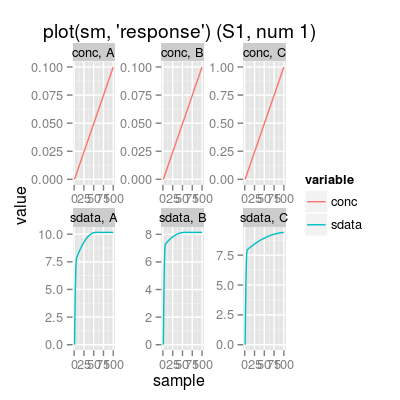
# get available model names model.names <- SensorModelNames() print(model.names)[1] "plsr" "mvr" "broken-stick" "ispline"# sensor model: custom parameters sm <- SensorModel(num=7, model="plsr", gases=c(1, 3)) print(sm)Sensor Model - num 7 - beta 2 - 2 gases A, C - (first) data model - method: plsr (type: mvr) - ncomp: 2 - sensor model: coeffNonneg FALSE -- coefficients (first): 0.186, 0.0116#plot(sm, uniman=TRUE) # add UNIMAN reference data (the model was build from) # method plot # - plot types 'y': response, predict sm <- SensorModel() # default sensor model plot(sm, "response", main="plot(sm, 'response')")
# default plot type, i.e. 'plot(sm)' does the same plotting conc <- concSample(sm, "range", gases=1, n=10) plot(sm, "predict", conc, gases=1, main="plot(sm, 'predict', conc, gases=1)")

See also
UNIMANshort